Are the unvaccinated responsible for the slowing economy? Not really
The Atlanta Fed’s GDPNow tracker downgraded its forecast for Q3 GDP growth again: it has now dropped from 6 percent at the end of July to 1.3 percent now. Then came the disappointing jobs report for September. This showed that U.S. employers added only 194,000 jobs that month to make it the second straight month in which the economy added far fewer jobs than expected. Jobs growth also slowed down dramatically in August.
President Biden blamed the unvaccinated — those who have chosen not to take one of the vaccines for COVID-19 — for the economy’s faltering performance. Is he right to do so?
We can answer this question by looking at the rates of vaccination in different states and seeing if it has any impact on job growth in those states and, if it does, what the magnitude of that effect is.
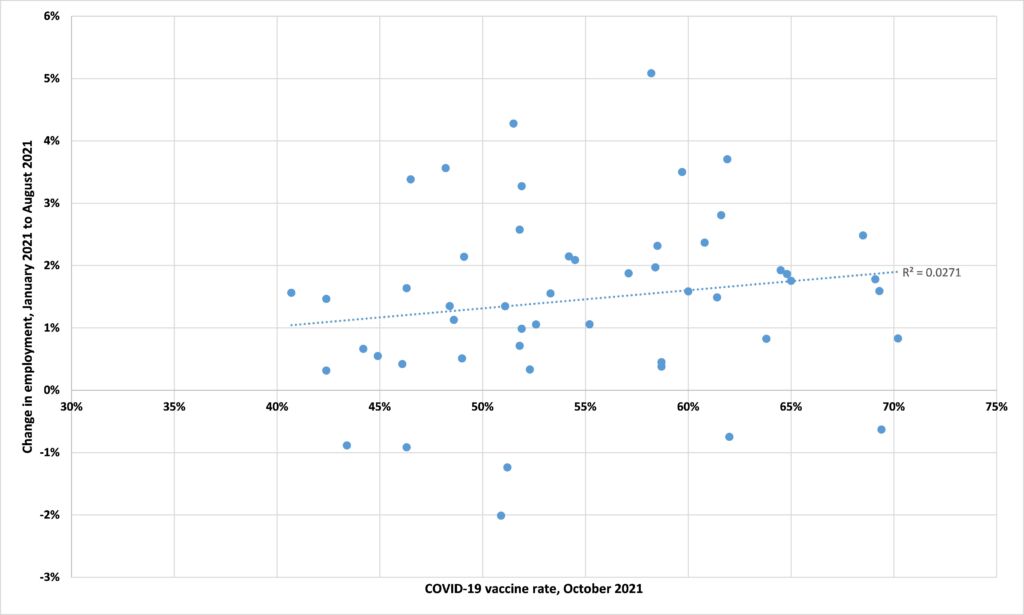
Figure 1 is a scatterplot showing the relationship between COVID-19 vaccine rates by state as of now and the change in employment in each state between January and August. We see a positive relationship between the vaccination rate in a state and job growth from January to February. But is this relationship ‘significant’ in a statistical sense?
Figure 1: COVID-19 vaccination rate and job growth
Source: Center of the American Experiment
To see whether or not the apparent relationship between vaccination rates and job growth seen in Figure 1 we see is causal (deterministic) rather than the result of randomness (stochastic) — we can calculate a p-value. A lower p-value indicates a stronger relationship and the rule of thumb is that p-values less than 0.05 indicate a relationship strong enough to be noteworthy. For our data set, the p-value is 0.000, indicating a highly significant relationship between state vaccination rates and job growth.
But how precise is that relationship? In other words, how much of the variation in job growth can be attributed to variations in vaccination rates? Eyeballing Figure 1 you might think ‘Not much’ given that so many of the dots are so far from the trendline. To be more precise, we can calculate an R squared value. This measures what fraction of variations in the outcome variable — job growth — is explained by variations in the factor variable — vaccination rates. For the data in Figure 1, the R squared is 0.0271, meaning that just 2.7 percent of the variation in job growth can be attributed to variations in vaccination rates.
So, if we want to explain why job growth between January and August 2021 was stronger in some states than in others, we need to find something else. Simply put, vaccination rates aren’t much of a factor. The ‘unvaccinated’ can’t be blamed for America’s slowing economy.